
Wednesday 10 August 2016
Presenting Our Argument
We have finished our research and now have our own opinions about the Conspiracy Theory that we have studied. It is time to convince Mr Nicoll that our opinion is the correct one... He will take some convincing!

Friday 1 July 2016


Wednesday 29 June 2016

Monday 20 June 2016
Conservation of Energy
Energy cannot be generated or destroyed. It just changes (transforms) or is transferred to something else. We used this to explain what happens with a bouncing spring:


Our next challenge was to try and do the same thing for pushing something off a cliff: a car; a boulder; a piano....
Friday 17 June 2016
Our Discussion
There are a few things we can focus on in our discussions. We need to include a fair bit of detail in each one (a full paragraph for each one). Here are some examples:


Thursday 9 June 2016
Constructing a Graph
Yesterday, we looked at how to construct a graph. There were a couple of key points:
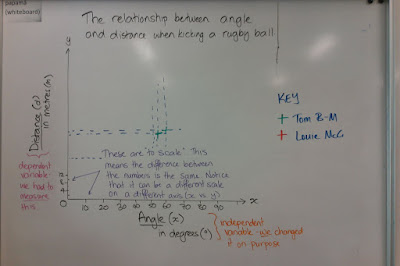
- Put the independent variable (the thing we changed on purpose) on the x-axis.
- Put the dependent variable (the other thing that we measured) on the y-axis.
- Use the aim of the investigation to write a good title.
Now, we are ready to start...

The next part was the hardest bit. We looked for the largest value for the independent variable and added up how many lines/boxes there were across the x-axis. This helped us work out the scale (the difference between each number we write along the axis). A scale is very important for a graph. Without the numbers going up in regular amounts (in 10's in the example above), the graph is meaningless.
We then did the same thing for the y-axis. In this example, a difference of 4 was decided to be the best for the data we had. Note that this is a different scale to the x-axis. That is okay, so long as it is still a scale.
Once we had done all of that, we started to plot our data...
For our rugby investigation, we have found the data very difficult to interpret, because we could not control the angle well enough. There are some good little trends that we will look at in today's lesson. There is also some good Science behind the trends we can see on the graph.
Thursday 2 June 2016
The Class vs. Nicoll
The class collaborated over the past two lessons to come up with a workable method. I had a method using cannons to model the kicking of the rugby balls. The class weren't so keen...
So, I challenged them to present a method that considered most variables and challenges and catered for them. The class won...
 The first thing the class did was to get into smaller groups, each focused on organising a key aspect of the investigation. There was too much to achieve in the time allowed if the class all worked on one task at a time. The teams:
 Today was Day One of our data collection. The "Method Team" took notes of any details they had not written in the original method. For example, they noted that measurements were being taken from the rearmost point where the ball landed. This is an important detail for consistency.
So, I challenged them to present a method that considered most variables and challenges and catered for them. The class won...
FOCUSED TEAMS/GROUPS

- Writing/refining the method
- Arranging/preparing equipment
- Recording distance
- Recording angle
The teams came together today and presented their method. It was a little different to what we initially hoped for, but accounts for enough variables that it may be valid.
DATA COLLECTION

The " Equipment Team" had arranged everything, ensuring all balls were 30 PSI etc. They also took on the kicking duties. The "Catchers" (measuring the distance) had results tables and recorded every valid kick, while they ignored those that were "shanked".
The "Filming Team" took control of who kicked and when. They recorded the kicks so the angle of each kick can be calculated at a later date. They ended up being the "directors" of today and did a great job!!
Subscribe to:
Posts (Atom)